

The same powerful QC workflow you expect from Baytek, in a lighter package.
QC/EZ is a SAAS statistical Quality Control charting solution, offering immediate deployment, simply elegant user interface, scalable features, and integrated D6299 workflow.
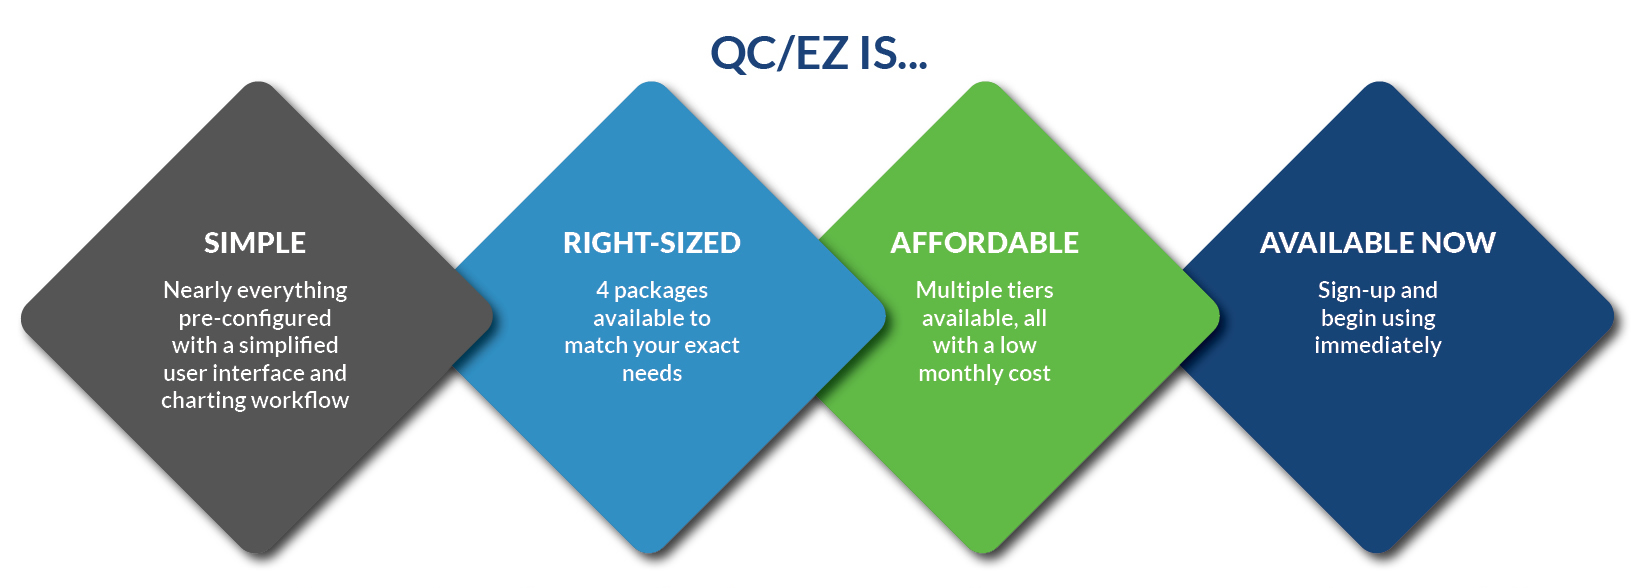
No software to buy or install, no servers to manage, no long-term contracts, no hidden fees. Get started immediately!
Managing the capability of analytical instrumentation has never been this EZ. Just login to QC/EZ web-application and manage your control charts.
No software to buy or install, no servers to manage, no long-term contracts, no hidden fees. Get started immediately!
Managing the capability of analytical instrumentation has never been this EZ. Just login to QC/EZ web-application and manage your control charts.
Do not wait another day to deploy an effective SQC program in your lab

Elegant D6299 Workflow and More
Standard Capabilities
Features
- Visual Status Indicators
- System Capability Monitoring
- Sample Backlog
- OOC Alerts
- Audit Records
- Exception Reports and Pareto Analysis
- Analyst Performance Review
- User Permissions Control
Benefits
- Easiest SQC Solution Available
- Reduce Variability
- Improve Quality
- Prevent vs React to Process Changes
- No Capital Expenditures
- Increase Profits
Comprehensive Charting
- I-Charts
- MR-Charts
- Q-Charts
- EWMA or Run Rule Strategy
- Q-Q Plot | Histogram
- Custom Defined Limits Percentile Charts
- EPA 0.75R Charts
- Z-Score Charts
- Pretreated Control Charts
Which Plan is Right for You?
QC/EZ Feature | Basic | Essential | Professional | Premier |
|---|---|---|---|---|
Number & Type of Users | 1 Super User | 1 Super User | 2 Super User | 3 Super User |
Number of Charts | 1 – 10 | 1 - 30 | 1 - 60 | 1 - 150 |
D6299 Workflows | ✅ | ✅ | ✅ | ✅ |
EPA Part 1090 Compliance Features | ✅ | ✅ | ✅ | ✅ |
Full Suite of Flexible Charting Options | ✅ | ✅ | ✅ | ✅ |
Pop-up Warnings when Entering Out-of-Control Results | ✅ | ✅ | ✅ | ✅ |
Data Collection, Normality Checks & D7915 Outlier Detection | ✅ | ✅ | ✅ | ✅ |
Immediately Create Chart from Existing Statistics | ✅ | ✅ | ✅ | ✅ |
Performance, Audit & Attestation Reports | ✅ | ✅ | ✅ | ✅ |
Real Time Chart Kiosk w/ Red & Green Status Borders | ✅ | ✅ | ✅ | ✅ |
Tracking of QC Material Lot # | ✅ | ✅ | ✅ | ✅ |
24/7 Emergency Support | ✅ | ✅ | ✅ | ✅ |
Additional Number of Users and Charts | ✅ | ✅ | ✅ | |
Performance Evaluation of Each Analyst | ✅ | ✅ | ||
TPI, Sigma Max & Bias Max Monitoring & Reports | ✅ | ✅ | ||
0.75*R & Pretreated Charts for ILCP/PTP | ✅ | |||
Email Notifications for Out-of-Control Results | ✅ | |||
XLS Export of Chart Results | ✅ |
Features in Every Tier
- Individuals Charts
- Q-Charts
- EWMA Overlay
- MR-Charts
- D6299 Strategy 1 or 2
- Percentile Charts
- Custom User Defined UCL/LCL Charts
- EPA 0.75*R Charts with Check Standards
- Pretreated I&MR Charts
- Z-Score Charts for PTP/ILCP
- Tracking of QC Material Lot #
- Exceptions Reports
- Elegant D6299 Workflow for Chart Management & Updates
- Real Time Chart Kiosk w/ Red & Green Status Borders
- Fully Auditable History of All Results, Actions, Limits
- Role Based Permissions Super User, QC Lead & Basic User
- No Install, Web-based & Accessible from Anywhere
- Pareto Analysis of Common Cause Variation